IdeaVaultHQ Template School
How To Build an Etsy Profit Tracker in Google Sheets for Digital Products
If you sell digital products on Etsy, revenue alone does not tell you enough. A profit tracker shows what is actually left after fees, ad spend, refunds, and small price changes. That makes pricing less emotional and product decisions less random.
Quick answer: Build one Google Sheets workbook with an Orders tab, a Fees tab, an Ads tab, and a Dashboard tab. Start with one real listing, enter the numbers you already have, and compare net profit instead of guessing from sales volume.
Profit Tracking Workflow
1. Why Etsy Sellers Are Asking For A Profit Tracker Right Now
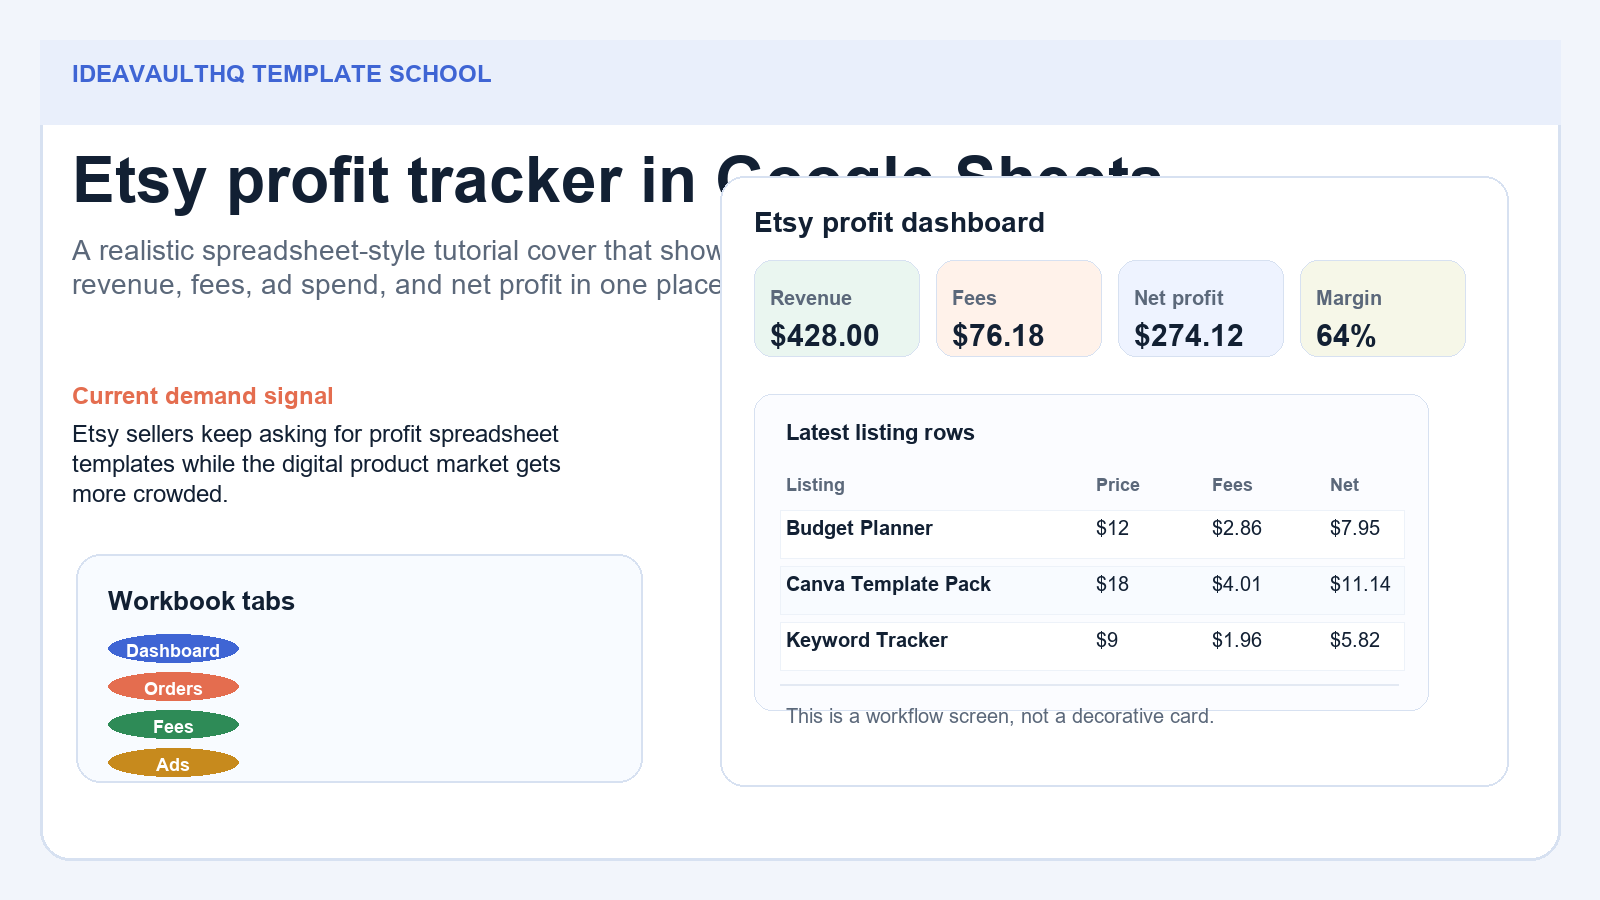
The current demand signal is obvious if you spend time in seller discussions. People keep asking for Etsy profit spreadsheet templates, compare notes about fees, and try to figure out whether their digital product sales are actually worth the time. That question has become more urgent as the digital product market gets more crowded. A shop can look busy on the outside and still leave very little profit after fees and ad spend are removed.
This tutorial is for beginners who want a practical view of their numbers without turning into accountants. It is also for template sellers who are trying to understand which products deserve more attention. If you make Canva templates, planners, trackers, or worksheets, the profit question matters because the same listing can make money on paper and still underperform once costs are added.
A spreadsheet is a good answer because it slows the problem down. It lets you look at one row, one listing, and one week at a time. That is usually enough to reveal whether the issue is price, fees, traffic quality, or a product that needs a better offer. The tracker does not replace judgment. It gives you a cleaner way to use it.
2. What Etsy’s Pricing Guidance Means In Practice
Etsy’s pricing guidance matters here because it treats pricing as a process, not a one-time guess. That idea is important for beginners. If you set a price once and never look at the result, you are not really pricing. You are hoping. The tracker helps you review the result and decide if the price, the offer, or the product mix needs to change.
Etsy’s seller handbook also keeps pointing sellers back to clarity, customer expectations, and the overall listing experience. That is useful because profit is not just math. A strong listing can justify a better price. A confusing listing can erase margin because shoppers hesitate, ask more questions, or click away. If the product is digital, the buyer also wants confidence that the file is easy to use.
The practical takeaway is simple: do not track profit in isolation. Track it next to the listing name, the product format, the traffic source, and the one change you made. That lets you connect Etsy’s pricing advice to a real outcome instead of leaving it as abstract theory. Once you do that, the sheet becomes a decision log, not just a calculator.
3. Decide What The Tracker Must Answer
Before you open Google Sheets, write the question the tracker should answer. A beginner-friendly question might be, “Which of my digital products keeps the most money after fees and ads?” A second question might be, “Which listings look busy but are not profitable?” A third could be, “Did my last price change improve net profit or only increase sales volume?”
Do not try to answer every possible business question in one workbook. If you want inventory, customer service, and tax reporting all in one place, you will end up with a sheet that is too complicated to maintain. Start with the narrowest useful version. For most sellers, that means revenue, fees, ad spend, refunds, net profit, and margin. Those numbers are enough to make better decisions on day one.
It also helps to pick one business model. A template seller cares about file format, delivery method, and editability. A planner seller may care more about bundles and upsells. A product research seller may care about traffic quality and conversion by keyword. The tracker should fit the way you work, not force every shop into the same shape.
4. Build The Workbook Structure Before You Add Formulas
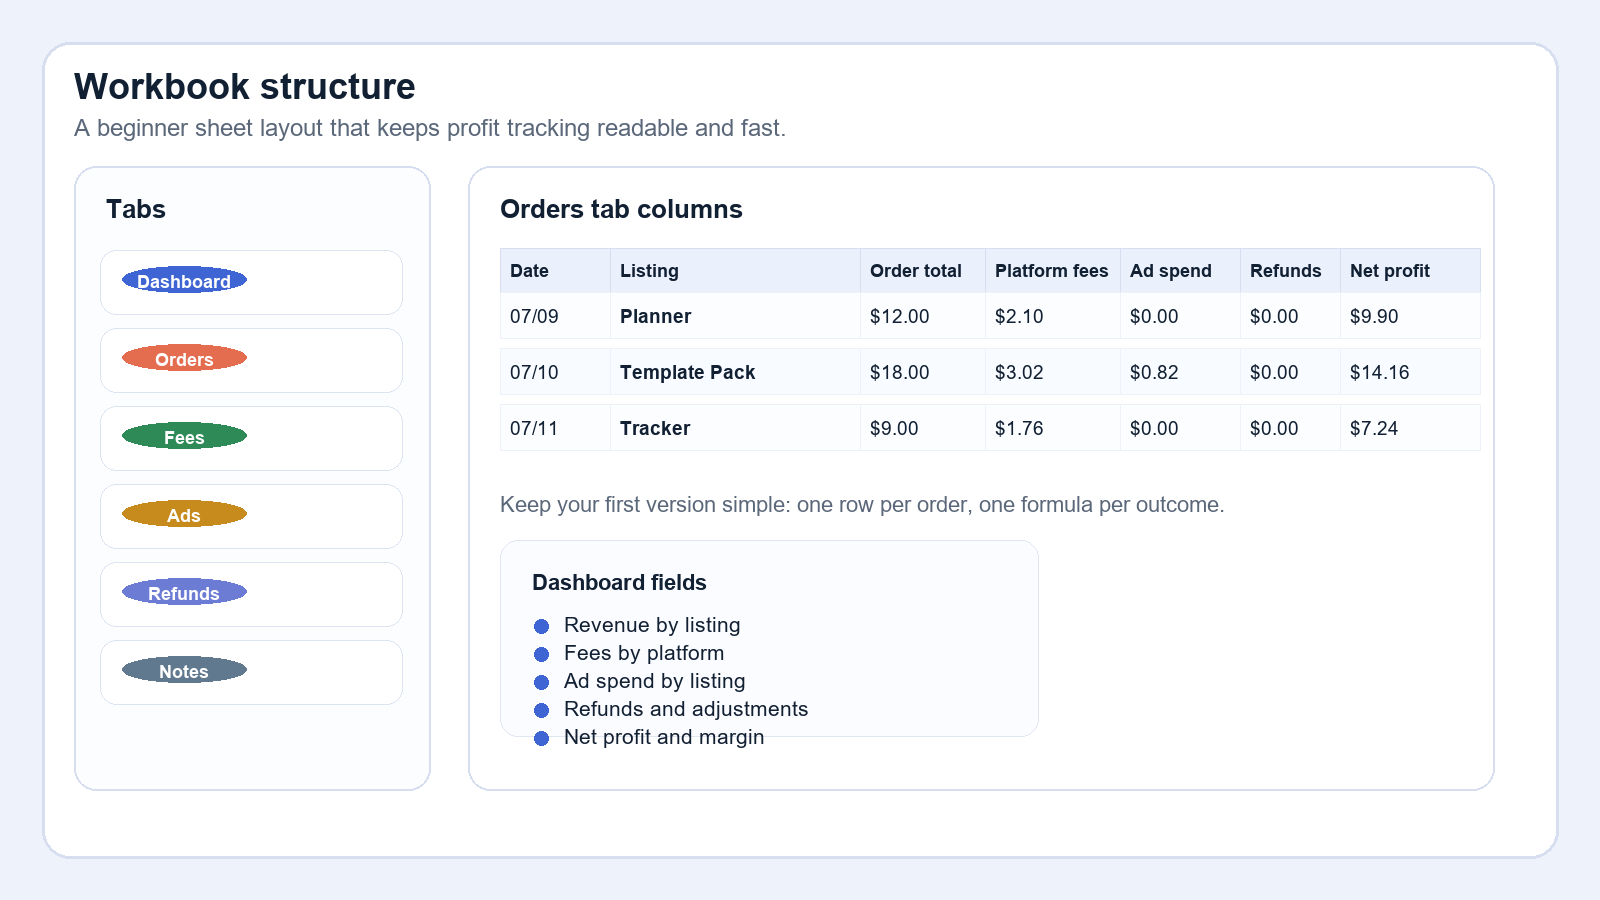
Open Google Sheets and create a blank workbook called Etsy Profit Tracker. Then make four tabs: Dashboard, Orders, Fees, and Notes. That is enough for a first version. The Dashboard gives you the summary. Orders is where the raw numbers live. Fees is where you keep the values that reduce profit. Notes is where you capture anything that might explain a shift in performance later.
Keep the headers plain and readable. In the Orders tab, add date, listing name, product type, order total, quantity, and order source. In the Fees tab, add platform fee, payment fee, ad spend, refund, and miscellaneous cost. In the Dashboard, summarize revenue, total costs, net profit, and margin by week or by month. The design should look like something you can update in two minutes, not something that needs a tutorial just to edit.
Freeze the top row. Use one header color and one accent color. If you want to make the file feel polished, add alternating row shading and keep the column widths wide enough that the text does not wrap badly. The more visually simple the workbook is, the less likely you are to abandon it after the first session.
5. Enter Real Costs Instead Of Guessing
The biggest beginner mistake is pretending profit is obvious. It is not. You need the actual order total and the actual costs that came with it. That can include marketplace fees, payment fees, ad costs, refunds, and any other amount that reduces the real take-home value of the sale. If you sell digital products, your costs may be small, but they are still costs.
Do not hardcode a fee assumption if you can avoid it. If the fee changes, your sheet should still be useful. Enter the value you see in the order record or the exact amount that was charged. This makes the tracker less glamorous and far more trustworthy. A few exact rows are better than a hundred guessed rows.
It helps to create a single “costs” habit. When a new order comes in, add it to the workbook once and move on. If you wait until the end of the month, the fees are harder to remember and the workbook becomes a chore. Beginners stick with tools that are fast. That means the tracker must be simple enough to update in the same session where you check your shop stats.
6. Use Simple Formulas For Profit And Margin
Once the raw numbers are in place, add two formulas that matter most: net profit and margin. Net profit is the amount left after fees, ads, refunds, and other costs are subtracted from revenue. Margin is the percent of revenue that stays in your pocket. Both numbers are useful because they show different problems. A listing with decent revenue can still have weak margin if the costs are too high.
You do not need an advanced finance model. Use a basic formula for each row. If the order total is in one column, the fees in another, and the ad spend in another, then the net profit cell should simply subtract those costs. Margin can be a second formula that divides net profit by revenue. That is enough to reveal whether the listing is healthy or just busy.
When you build the formulas, test them on three sample rows before you trust them. Make sure the answers look sensible. If one value is off, fix the formula immediately. Beginners often assume formula errors are a normal part of spreadsheets. They are not normal if you are using the file to make pricing decisions. Accuracy is the point of the tracker.
7. Add A Dashboard That Shows The Business Story Fast
The Dashboard tab should tell the story in a few seconds. That means top-line revenue, total costs, net profit, and margin. If you want one extra level of detail, add a breakdown by product type or by listing. That can help you see whether planners, template packs, or trackers are doing the best job of keeping profit after fees and ads.
If you like color rules, use them carefully. A soft green cell can highlight healthy margin. A warm amber cell can mark a low-profit listing. A muted red cell can mark a negative result or a refund-heavy order. The colors are not there to decorate the sheet. They are there to help you notice the rows that need attention. If you have to stare at the file for more than a few seconds to find the problem, the dashboard is too busy.
Make sure the Dashboard still works on a laptop screen. Many beginner sheets look polished only when zoomed in. If you cannot read it comfortably at normal scale, simplify the layout. One of the best things about Google Sheets is that it can stay useful even when it looks plain. Plain is fine. Clear is what matters.
8. Review The Tracker Once A Week And Decide One Thing
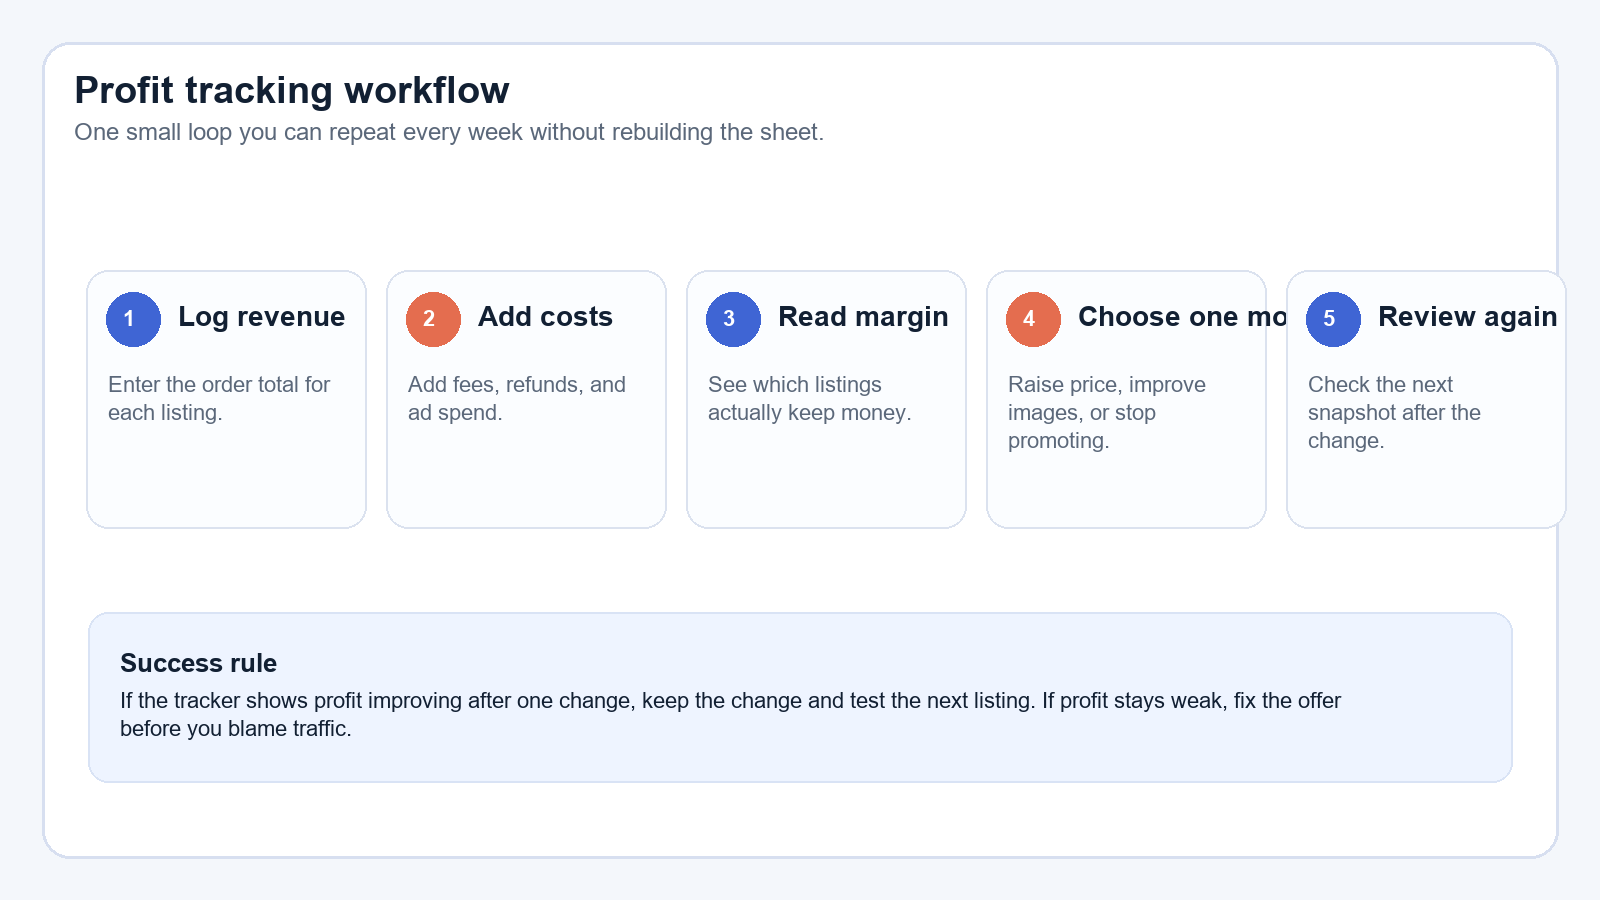
A tracker only matters if you use it again. Pick one weekly review day and keep it short. Open the workbook, refresh the newest order rows, and compare the latest profit and margin against the previous week. If the numbers changed, ask why. If the numbers did not change, ask whether the listing needs a different price, a clearer offer, or a better traffic source.
The most useful habit is choosing one move per review. Beginners often want to rewrite the title, replace the images, change the price, and launch a new product at the same time. That makes the tracker useless because you cannot tell which change caused the result. One move at a time is slower, but it is how you actually learn.
Write a short note next to each review. For example: “Margin improved after removing ads from the lower-priced listing.” Or: “Template pack has revenue but weak profit because of refund adjustments.” Those notes become the memory of the business. Over time, they help you see which decisions are repeating and which ones are one-off noise.
9. Make The Sheet Specific To Digital Products
Digital products need different columns than handmade items or physical inventory. A digital seller may want to track product type, file format, delivery method, and the main buyer promise. A Canva template seller may want a note on whether the template is editable, bundled, or a single-page file. A Google Sheets template seller may want to note whether the file is a tracker, calculator, planner, or dashboard.
That extra detail matters because it helps you compare like with like. If you track a budget planner next to a listing image pack, the numbers might confuse you unless the product family is visible. Once the file type is obvious, you can see whether templates, trackers, or prompt packs deserve more attention. The sheet becomes a small product research tool as well as a profit tracker.
This is also where the tracker starts to connect to your content strategy. If one product type consistently leaves better margin, you can write more tutorials around it, make better previews, and create more variations. That means the sheet is not just recording history. It is pointing toward the next tutorial, the next bundle, or the next product line.
10. Turn It Into A First $5/Day Asset
If you want a realistic first $5/day path, this file can do two jobs. First, it can help you improve your own shop by showing which listings are worth continuing. Second, it can become a small digital product if you package it clearly. A clean Etsy profit tracker with a short PDF guide and a few preview images can be priced low enough for a beginner buyer and useful enough to feel like a bargain.
The trick is to keep the first version small. Do not add a dozen dashboards or build a complicated finance suite. Make one useful workbook with a clear example row, a few notes, and a simple quick-start guide. If you want to sell it, show exactly what a buyer will get. The same clarity that improves profits also improves conversions for the product itself.
You can also reuse the template across related tutorials. A version for Etsy profit tracking, a version for Canva template sellers, and a version for product research can share the same sheet structure. That gives you a repeatable product line instead of a one-off file. Reusable systems are how low-cost templates start to compound.
11. Risks And Warnings
Do not assume a spreadsheet can fix a weak offer. If a product is poorly explained or priced badly, the tracker will only prove that the business has a problem. That is still useful, but it is not magic. Also, avoid tracking so many numbers that the sheet becomes a burden. Profit trackers work best when they are narrow and repeatable.
Be careful with fee assumptions. Platform fees can vary by market and product setup, so use the actual numbers from your account whenever possible. If you make ad spend part of the workbook, be honest about it. It is tempting to leave ad costs out because they make profit look worse. Do not do that. A tracker is only helpful when it is honest.
Finally, remember that one week of data is not a trend. Let the tracker collect enough rows to say something meaningful. You are looking for repeated patterns, not perfect predictions. If you keep the workbook simple and consistent, it will help you make better choices without pretending to control the market.
How To Get Started Today
Open Google Sheets and create the four tabs. Add the columns you actually need. Enter one real listing and one recent order. Then calculate net profit once before you do anything else. If you can finish that today, you already have a working system. Later, you can turn it into a cleaner template or a product page.
The main goal is not spreadsheet perfection. The goal is to stop guessing about profit. If the workbook helps you make one cleaner pricing decision, it has already done its job.
Beginner Checklist
- Create the Dashboard, Orders, Fees, and Notes tabs.
- Enter one real listing and one real order before adding extras.
- Track revenue, fees, ad spend, refunds, and net profit.
- Freeze the header row and keep the workbook readable on mobile.
- Review the file once a week and choose one change only.
- Save a clean copy if you want to turn the tracker into a product.
- Use actual fee values instead of guessing.
- Keep the dashboard simple enough to update in two minutes.
Copy-Paste ChatGPT Prompt
Use this prompt after you paste in your own tracker rows and notes.
You are my Etsy profit analysis assistant. I sell digital products like Canva templates, planners, and Google Sheets files.

Here are my tracker rows and notes:
[paste your own rows, costs, and weekly review notes here]

Help me:
1. Summarize which listing is actually the most profitable.
2. Point out the biggest cost or fee that is reducing margin.
3. Suggest one pricing change I should test next.
4. Suggest one product or listing improvement I should test next.
5. Write a plain-English weekly action plan I can follow.

Rules:
- Use only the numbers I provided.
- Do not promise sales or profit.
- Keep the advice beginner-friendly and specific.
- Focus on one change at a time.
- If the numbers are unclear, ask a clarifying question instead of guessing.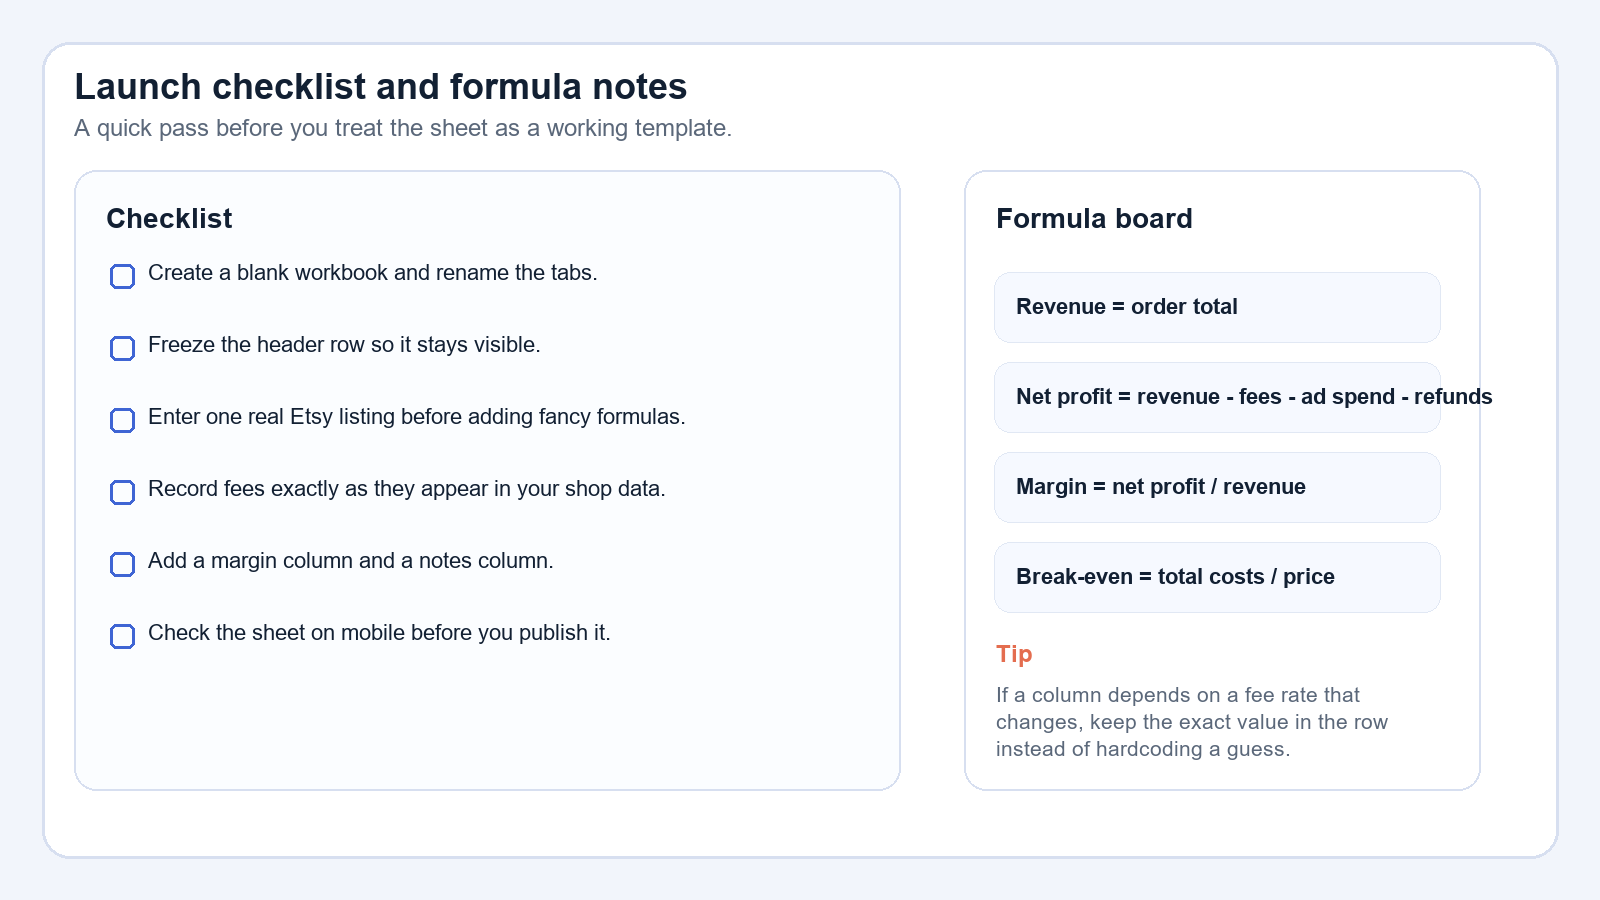
Source Links
Continue Learning On IdeaVaultHQ
This guide is part of the IdeaVaultHQ Template School path. Use the links below to keep moving instead of stopping on one article.
Leave a Reply